
A.T.A. Shares June 2026 Results and 2025 Cruise Tourism Survey Findings
ORANJESTAD – The Aruba Tourism Authority (A.T.A.), through its Department of Strategy, Planning, and Research (SPR), has presented the results of its 2025 Annual Cruise Tourism Survey.
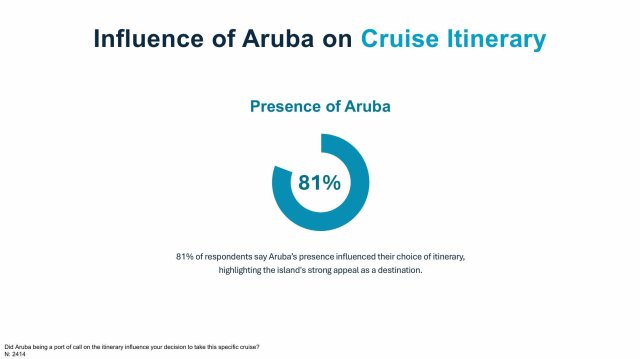
The study, based on 2,414 surveys collected throughout 2025, offers valuable insights into the profile, behavior, and overall experience of cruise visitors to Aruba. Results confirm that Aruba holds a strong position as a cruise destination, with 81% of respondents indicating that Aruba's inclusion on the itinerary influenced their decision to book that specific cruise—an increase from 78% in 2024.
The research also highlights high visitor satisfaction. All 14 measured attributes showed improvement compared to 2024, with beaches, safety, and local hospitality receiving the highest scores. Furthermore, average per-person expenditure during a cruise stop reached $197 USD, driven primarily by spending on excursions, local crafts, and food and beverage (F&B). These figures demonstrate how cruise tourism continues to generate vital economic activity across multiple sectors on the island.
Updated Stayover Tourism Statistics: Arrivals, Length of Stay, and Market Share
In June 2026, Aruba welcomed a total of 143,343 stayover visitors and recorded 912,256 visitor nights, with an average length of stay (ALOS) of 6.4 nights. These figures confirm a strong, positive performance for the tourism industry throughout the month.
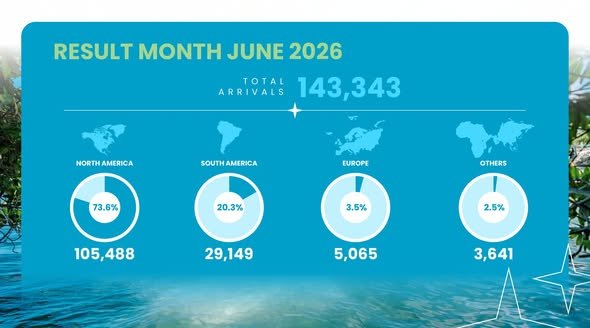
North America remained the primary source market in June, representing 73.6% of total arrivals. South America contributed 20.3%, Europe accounted for 3.5%, and other regions made up the remaining 2.5%. The United States was the largest individual market with 102,224 visitors, while Argentina registered 11,682 visitors—a sharp increase compared to June 2025. The Netherlands led the European market with 2,755 visitors.
Demographic data reveals that Aruba attracts a diverse mix of generations. In June 2026, Generation X made up 26.8% of total visitors, followed by Millennials at 25.4%, Generation Z at 20.8%, and Baby Boomers accounting for 18.8% of arrivals.
Visit www.ata.aw to access the complete A.T.A. Monthly Statistical Report.